I came across this example http://jbdynamo.blogspot.co.uk/2017/08/ammo-watershed-analysis-in-revit-flux.html and this one http://archi-lab.net/colored-surface-analysis-display-with-mantis-shrimp-and-ladybug-continued/ which explain how to use the Revit’s Analysis Visualization Framework to display the results of external analysis computations on top of the Revit model.
The graphics generated are NOT residents of the database – so they don’t add to the size of the Revit model (and they don’t persist – to preserve the result display, you must save its view to the project as an image).
More info here:
http://aucache.autodesk.com/au2011/sessions/5229/class_handouts/v1_CP5229-SeeingDataAndMore-TheAVFinRevitAPI.pdf
https://knowledge.autodesk.com/support/revit-products/learn-explore/caas/CloudHelp/cloudhelp/2014/ENU/Revit/files/GUID-DCA1C6D3-FBD0-4188-A5C2-51821027435E-htm.html

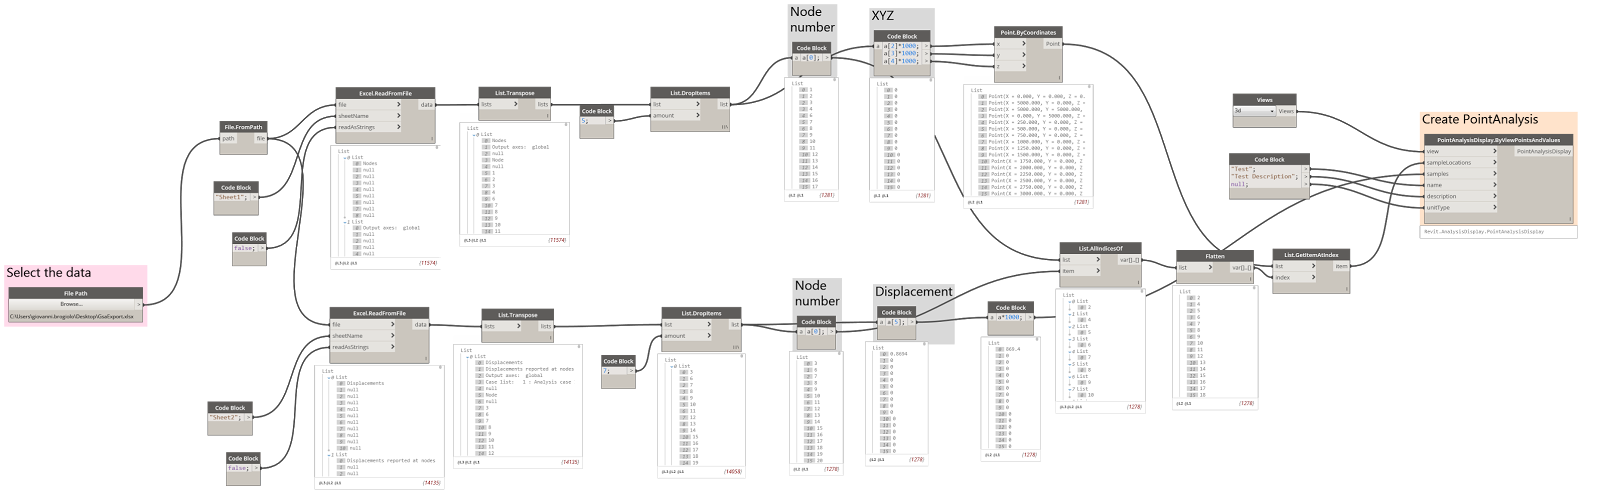
The Point Analysis Display node needs a View, Point Coordinates (sampleLocations) and a value associated to the point (samples).

Name, description and unitType refers to the Analysis Display Settings window:

To assign a colour legend to the points we need to create an Analysis Display Style:

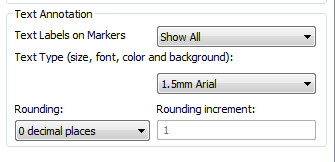
Text annotations can be turned on selecting "Show All" in the Analysis Display Styles Settings tab:
The dynamo script can be downloaded here and the data used here
The graphics generated are NOT residents of the database – so they don’t add to the size of the Revit model (and they don’t persist – to preserve the result display, you must save its view to the project as an image).
More info here:
http://aucache.autodesk.com/au2011/sessions/5229/class_handouts/v1_CP5229-SeeingDataAndMore-TheAVFinRevitAPI.pdf
https://knowledge.autodesk.com/support/revit-products/learn-explore/caas/CloudHelp/cloudhelp/2014/ENU/Revit/files/GUID-DCA1C6D3-FBD0-4188-A5C2-51821027435E-htm.html
The Point Analysis Display node needs a View, Point Coordinates (sampleLocations) and a value associated to the point (samples).

Name, description and unitType refers to the Analysis Display Settings window:
To assign a colour legend to the points we need to create an Analysis Display Style:
Text annotations can be turned on selecting "Show All" in the Analysis Display Styles Settings tab:

The dynamo script can be downloaded here and the data used here
Commenti